Home Page » About Us » Case History » Wood Stove Testing System
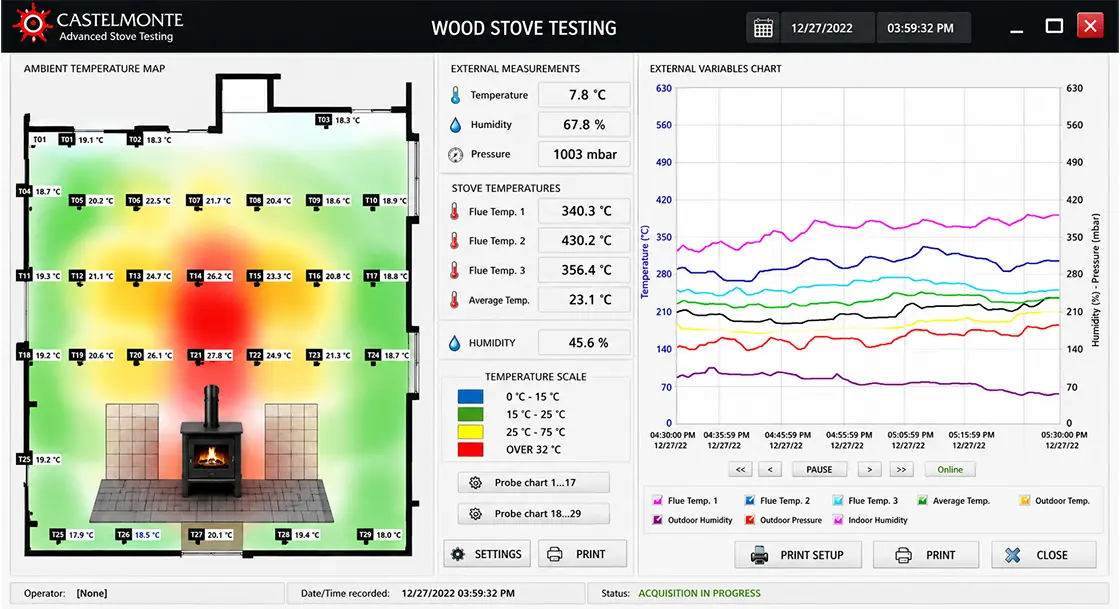
SCADA for comparative testing of wood stoves: thermal mapping and environmental monitoring
Sielco Sistemi —
Independent test laboratories and manufacturers who evaluate a wood-burning stove’s performance need more than a single thermometer near the appliance: they need to compare how different stoves heat the same room, under the same environmental conditions, in a way that produces objective, repeatable numbers rather than impressions. Comparative testing of wood stoves calls for a data acquisition system that can capture a full spatial and environmental picture of the test room, correlate it with combustion behaviour, and keep every reading on record for later analysis. Winlog Evo is a reference example of a SCADA/HMI platform built to support exactly this kind of instrumented test bench, whether the appliances under test are traditional cast-iron wood stoves, pellet stoves, or newer high-efficiency designs evaluated side by side in the same climate-controlled room.
Test bench architecture: SCADA client and data acquisition network
At the core of a wood stove test bench sits a SCADA client workstation connected, over a TCP/IP server, to a network of distributed data acquisition modules spread around the test room and the flue. This architecture keeps the wiring local to each cluster of sensors while giving the operator a single point from which to start a test session, watch live readings and review the results once a burn cycle is complete. Winlog Evo’s library of communication drivers connects the SCADA client to the acquisition modules regardless of the specific hardware chosen for a given test rig, and the device support list makes it straightforward to check compatibility before adding a new measurement channel to an existing test setup. Because a test laboratory may need to check on a long, unattended burn cycle from another office or site, SecureBridge lets an engineer reach the test bench’s SCADA client remotely, over an encrypted and authenticated connection, without exposing the acquisition network directly to the internet.
Pt100 sensor matrix and thermographic mapping of the test room
A single sensor cannot tell a test engineer whether a stove heats a room evenly or leaves cold corners, so the test room is instrumented with a full matrix of Pt100 temperature sensors. Pt100 probes are a type of resistance thermometer whose electrical resistance changes in a well-known, highly stable way with temperature, which is why they are the standard choice whenever a test protocol demands accurate, repeatable readings rather than a rough estimate. Distributed at different heights and positions around the room, the matrix captures the spatial temperature distribution produced by each stove being tested. Within the SCADA environment, this grid of readings is rendered as thermographic maps — a technique related to thermography — so that a test engineer can see at a glance where the room is warmest, where it lags behind, and how that pattern shifts as the stove’s combustion cycle progresses. Turning dozens of individual Pt100 channels into a single color-coded picture is far faster to interpret than scrolling through a table of numeric values, especially when several stoves and test runs need to be compared side by side.
Correlating temperature with humidity, pressure and flue gas data
Room temperature alone does not explain why one test session behaved differently from another: indoor and outdoor humidity, atmospheric pressure and flue gas temperature all influence how a wood stove burns and how the heat it produces spreads through the room. To make these relationships visible, the data acquisition system is integrated with sensors that measure indoor and outdoor humidity, atmospheric pressure, and the temperature of the flue gas leaving the stove, alongside the Pt100 matrix. Winlog Evo’s development tools let a test laboratory add custom calculated values — such as a derived combustion efficiency indicator — directly inside the SCADA project, so environmental readings and thermal maps can be interpreted together rather than as separate data sets that need to be reconciled afterwards by hand.
Continuous data logging and trend analysis
None of this instrumentation is useful if the readings disappear once a test session ends, so all acquired data — temperature matrix, humidity, pressure and flue gas values — are continuously recorded and stored for later review, comparison between stoves, and reporting to clients or certification bodies. The same historical archive that feeds a live thermographic map also drives trend charts, which let a test engineer examine the temporal evolution of a single measurement point, such as one Pt100 probe near the stove, or of a whole group of related parameters plotted together, such as flue gas temperature against room temperature over an entire burn cycle. Because Winlog Evo’s web server module can publish the same live data and trend views to a browser, colleagues who are not at the test bench itself can still follow a session as it happens, and a free evaluation copy of the platform is available for laboratories that want to try building this kind of test project themselves.
Why comparative testing and consistent data matter
Wood stove efficiency and emissions are increasingly scrutinised by regulators and certification programmes such as the US EPA Burnwise initiative, which promotes cleaner-burning, more efficient wood heaters and the testing that supports those claims. A SCADA-based test bench does not replace a certification laboratory’s own procedures, but it gives manufacturers and independent testers the same discipline applied earlier in the process: identical instrumentation, identical logging, and directly comparable thermographic maps and trend charts for every stove under evaluation. That consistency is what turns a single test session into evidence that a client, a certification body, or an engineering team can actually rely on when comparing one wood stove design against another.
Curious how this looks in a real test laboratory? Try the Winlog Evo web demo, check the support resources available for a new test bench project, or contact Sielco Sistemi to discuss a wood stove testing installation.
FAQ
- What does the SCADA system monitor during a wood stove comparative test?
- It monitors the spatial temperature distribution captured by a matrix of Pt100 sensors in the test room, together with indoor and outdoor humidity, atmospheric pressure and flue gas temperature, all acquired through a network of data acquisition modules connected to a TCP/IP server.
- Why are Pt100 sensors used instead of a single room thermometer?
- A single thermometer cannot reveal whether a stove heats a room evenly or leaves cold spots, while a full matrix of Pt100 resistance thermometers, distributed at different heights and positions, captures the actual spatial temperature distribution needed for an accurate thermographic map.
- How are thermographic maps generated from the Pt100 sensor readings?
- Within the SCADA environment, the grid of readings collected from the Pt100 matrix is rendered as a color-coded thermographic map, turning dozens of individual temperature channels into a single image that shows at a glance where the test room is warmer or cooler.
- How does the system correlate temperature data with humidity and flue gas conditions?
- The data acquisition system is integrated with additional sensors for indoor and outdoor humidity, atmospheric pressure and flue gas temperature, and Winlog Evo’s development tools allow custom calculated values to be added directly inside the SCADA project so environmental readings and thermal maps can be interpreted together.
- Can data from a wood stove test session be reviewed after the test is finished?
- Yes, all acquired data are continuously recorded and stored, and trend charts let a test engineer examine the temporal evolution of an individual measurement, such as one Pt100 probe, or a whole group of related parameters together, such as flue gas temperature against room temperature over an entire burn cycle.