Home Page » About Us » Case History » Energy Management
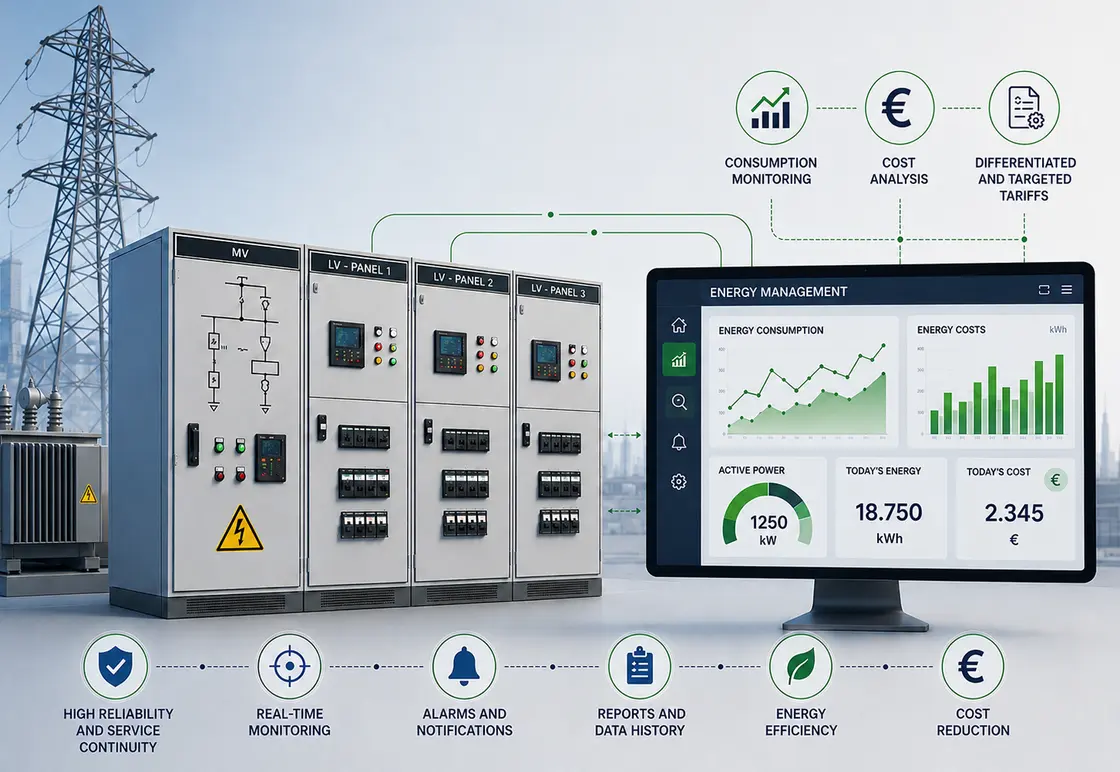
Supervision of Low and Medium Voltage Networks
Sielco Sistemi —
The continuous increase of energy costs, combined with the growing ability to compare and select the most suitable contract among different energy providers, is making a dedicated supervisory system an essential investment rather than an optional upgrade. In liberalized energy markets, prices change according to time slots, seasons and provider tariffs, and organizations that cannot track their real consumption in real time are effectively negotiating blind. A modern SCADA platform able to ensure continuous monitoring of power consumption and energy costs across low and medium voltage networks gives plant managers, energy managers and facility owners the visibility they need to control spending, plan budgets and reduce waste. According to the International Energy Agency, energy efficiency and demand-side monitoring remain among the most cost-effective levers available to industrial and commercial users facing volatile energy markets.
Continuous Monitoring with Winlog Evo SCADA Software
Thanks to Winlog Evo SCADA software, it has been possible to develop numerous supervisory applications able to provide both the continuous monitoring of the electrical network and the means to increase its overall efficiency. As a complete Supervisory Control and Data Acquisition (SCADA) environment, Winlog Evo was designed to turn raw electrical data into actionable information, combining real-time visualization, historical data logging and automatic reporting in a single integrated platform. This makes it equally suitable for a single distribution cabinet or for a distributed network spanning multiple buildings and production sites.
Visualizing Electrical Schemes, Switchboards and Cabinets
Winlog Evo includes a rich library of internal objects specifically designed to display electrical schemes and switchboard cabinets, monitor power consumption, and calculate energy costs using either real or simulated calendars with different tariffs according to date and time. Animated switches and lines that change colour according to the current path running through them allow operators to visually highlight active energy flows, quickly spot abnormal operating conditions and prevent possible power overloads before they cause downtime. This graphical approach transforms a traditionally static electrical diagram into a live, intuitive representation of how energy actually moves through the plant, drastically reducing the time needed to diagnose faults or unbalanced loads.
Real-Time Power Consumption Monitoring and Energy Flow Analysis
Beyond simple visualization, the platform continuously tracks power consumption at every measurement point of the network, from the main incoming line down to individual feeders and user circuits. This level of granularity is at the core of any modern smart grid approach to electrical distribution, where visibility at the sub-meter level is what allows inefficiencies, harmonic disturbances and unexpected consumption peaks to be identified early. By correlating consumption data with operating schedules, maintenance teams can also detect equipment that is drawing more power than expected, often a leading indicator of mechanical wear or impending failure.
Flexible Tariff Calendars for Accurate Energy Cost Calculation
One of the most valuable features of Winlog Evo is the possibility to program a yearly tariff calendar with different energy fares according to date, time band and season, mirroring the complex pricing structures used by most electricity suppliers. This approach is closely related to time-of-use pricing and demand response strategies, where shifting consumption away from peak hours can generate significant savings. The system can apply real tariffs already negotiated with a provider, or simulate alternative tariff scenarios, giving energy managers a powerful "what-if" tool to compare offers before signing a new supply contract.
Seamless Integration with Field Devices and PLCs
Winlog Evo communicates natively with the most widely used field devices and protocols, including Modbus RTU/TCP, KNX, OPC DA/UA and direct drivers for major PLC brands. In electrical network supervision projects, this typically means interfacing with energy meters, protection relays and controllers such as the Siemens SIMATIC S7-1500 PLC family, which is frequently used to manage switchgear logic and acquire metering data at the cabinet level. This native connectivity removes the need for custom middleware and ensures that data reaches the SCADA layer with minimal latency and maximum reliability, even in plants with heterogeneous, multi-vendor electrical equipment.
Daily, Monthly and Yearly Reporting for Budget Planning
Monitoring power consumption and energy costs of single user lines, as well as of the overall network, in the form of daily, monthly and yearly bar charts provides an ideal report for analysis and optimization of the electrical network. These automatically generated reports give plant managers a clear, immediately understandable picture of where energy is being spent, which lines are the most expensive to operate, and how consumption trends evolve over time. Historical data can be exported and shared with finance and operations teams, supporting cross-department decision-making rather than leaving energy data siloed inside the technical department.
From Energy Data to Industry 4.0 Integration
The same datalogger architecture that records consumption and cost data can also feed broader Industry 4.0 initiatives, since Winlog Evo supports direct interfacing with external databases such as MySQL through ODBC, as well as MQTT connectivity for sending field variables to cloud platforms. This means energy data collected for tariff calculation and reporting purposes does not have to remain isolated: it can be cross-referenced with production data, machine cycle times and maintenance logs to build a complete picture of the relationship between energy consumption and productivity. Remote access through the Web Server module also allows energy managers and technicians to check consumption trends and electrical scheme status from a browser, smartphone or tablet, without needing to be physically present on site.
Choosing the Right Energy Contract with Confidence
The possibility to program the yearly calendar with different fares according to date and time is an essential tool to prepare a reliable budget plan and to select the energy contract best suited to a company’s actual consumption profile, rather than relying on estimates or generic tariff brackets. By combining live electrical scheme visualization, granular consumption monitoring, flexible tariff simulation and automated reporting in a single Winlog Evo SCADA application, organizations gain a continuous, data-driven view of their low and medium voltage networks, turning energy management from a reactive cost center into a proactive lever for efficiency and competitiveness.
FAQ
- What is Winlog Evo and how does it help monitor an electrical network’s power consumption and costs?
- Winlog Evo is a SCADA software platform developed by Sielco Sistemi for building supervisory applications on low and medium voltage electrical networks. It combines real-time visualization of electrical schemes, power consumption monitoring and automatic daily, monthly and yearly reporting in a single integrated system, giving plant managers full visibility over energy use and costs.
- How does Winlog Evo calculate energy costs for different time bands and tariffs?
- Winlog Evo lets you program a yearly tariff calendar with different rates by date, time band and season, using either real tariffs already negotiated with a provider or simulated scenarios. This makes it possible to compare different offers and estimate costs accurately before signing a new energy supply contract.
- Can Winlog Evo visualize electrical schemes and switchboard cabinets in real time?
- Yes. Winlog Evo includes objects specifically designed to represent electrical schemes and switchboard cabinets, with animated switches and lines that change colour according to the current path. This makes it easy to highlight active energy flows, quickly spot abnormal operating conditions and prevent power overloads before they cause downtime.
- Which field devices and protocols can be integrated with Winlog Evo for electrical network supervision?
- Winlog Evo communicates natively with the most widely used protocols, including Modbus RTU/TCP, KNX and OPC DA/UA, as well as with PLCs such as the Siemens SIMATIC S7-1500. This allows direct interfacing with energy meters, protection relays and switchboard controllers without the need for additional custom middleware.
- What kind of reports does Winlog Evo provide for budget planning and contract selection?
- Winlog Evo generates daily, monthly and yearly bar-chart reports of power consumption and energy costs, both for individual user lines and for the network as a whole. These reports give plant managers the historical data needed to prepare a reliable budget and to select the energy contract best suited to their actual consumption profile.