SCADA alarms and trends: configuring event history, charts and dashboards
Sielco Sistemi —
Raw process data only becomes useful once it is turned into alarms operators can act on, history they can audit, and trends they can diagnose from. SCADA alarms, event history, charts and dashboards are the tools that make this possible, and getting them right is often what separates a system operators trust from one they learn to ignore. This guide covers how to configure each of these areas in a platform such as Winlog Evo.
Alarm management (priorities, acknowledgements, escalation)
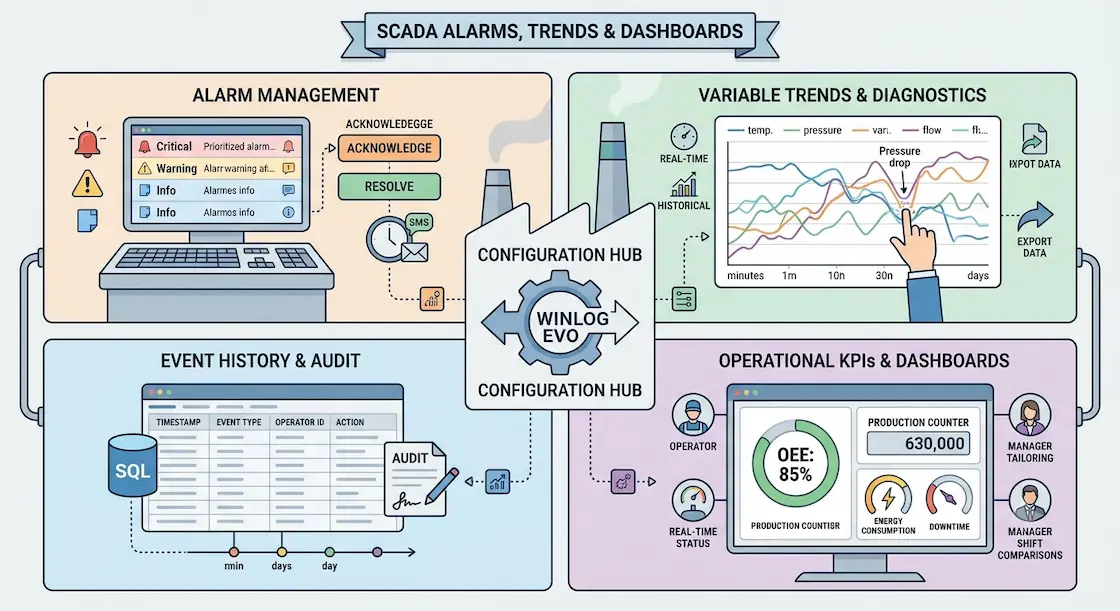
Effective alarm management starts with priority levels that reflect real operational impact, not just technical severity: a high-priority alarm should demand immediate action, while informational events should stay out of the operator’s way. Each alarm needs a clear acknowledgement workflow, so the system can distinguish between "seen" and "resolved," and escalation rules that notify a supervisor or send an SMS/email if an alarm remains unacknowledged past a defined time. These practices align with the alarm management guidance published by the International Society of Automation (ISA-18.2), which most industrial SCADA deployments use as a reference framework.
Alarm and event history (analysis and audit)
SCADA event history is the searchable record of every alarm, operator action and system event over time, and it is essential for two very different purposes: operational analysis and compliance audit. For analysis, being able to filter and export event history helps identify recurring faults on specific assets and quantify how alarm frequency correlates with downtime. For audits, a complete, tamper-evident event log is often a regulatory requirement, particularly in pharmaceutical, food and energy sectors, and the ability to write this history directly to a SQL database makes both use cases far easier to support than proprietary log formats.
A well-structured event history also records who did what: which operator acknowledged an alarm, changed a setpoint, or forced an output, and when. This operator-action trail is often just as valuable during an incident investigation as the alarm data itself, since it shows the sequence of human decisions that led up to, or responded to, a given event.
Variable charts and trends (diagnostics)
Variable trends let operators and engineers see how a value evolved over minutes, days or months, and overlaying multiple variables on the same chart is often the fastest way to diagnose a process anomaly — for example, correlating a pressure drop with a pump’s current draw. Good trending tools support both real-time and historical views, configurable time ranges, and the ability to export data for deeper analysis. This diagnostic capability is what turns a SCADA system from a passive monitor into an active troubleshooting tool.
Trends are also the foundation for predictive maintenance: gradual drift in vibration, temperature or cycle time, visible only over weeks of trend data, is often the earliest warning of a bearing, pump or motor heading toward failure, long before it would trigger a hard alarm threshold.
Dashboards and operational KPIs
A SCADA dashboard distills alarms, trends and production data into a small set of operational KPIs that management can check at a glance: OEE, downtime, energy consumption, alarm counts and throughput are common choices. The best dashboards update automatically, require no manual data entry, and are tailored to the audience — an operator dashboard emphasizes real-time status, while a management dashboard emphasizes trends and comparisons across shifts, lines or sites.
Dashboards work best when the number of KPIs shown is deliberately kept small: a screen with twenty indicators is harder to act on than one with five well-chosen ones, so it is worth periodically reviewing which KPIs actually drive decisions and retiring the ones that do not.
Best practices (thresholds, noise reduction, naming)
Reducing false alarms is one of the highest-value improvements a plant can make to its SCADA configuration. Practical techniques include setting deadbands so an alarm does not chatter around a threshold, adding short time delays before an alarm activates to filter out transient spikes, and reviewing alarm rationalization periodically to remove or reprioritize alarms that never require action. Consistent tag and alarm naming conventions across the plant also make it much easier for new operators and integrators to understand the system quickly, reducing training time and troubleshooting effort.
A simple but often overlooked practice is tracking the average number of alarms per operator per shift: industry benchmarks based on ISA-18.2 suggest that manageable operations stay well under ten per hour on average, and a plant consistently exceeding that is a strong signal that its alarm configuration needs rationalization, not that its process is inherently unstable.
Want to see alarm management, trends and dashboards configured in practice? Try the Winlog Evo web demo, review the supported communication drivers, or contact Sielco Sistemi for guidance.
FAQ
- What should a good SCADA alarm management strategy include?
- A good strategy includes priority levels reflecting real operational impact, a clear acknowledgement workflow, and escalation rules that notify a supervisor if an alarm stays unacknowledged, following frameworks such as ISA-18.2.
- Why is SCADA event history important for audits?
- A complete, tamper-evident event log recording every alarm and operator action is often a regulatory requirement, particularly in pharmaceutical, food and energy sectors, and writing it directly to SQL makes it easier to audit than proprietary formats.
- How do variable trends help with predictive maintenance?
- Gradual drift in vibration, temperature or cycle time, visible only over weeks of trend data, is often the earliest warning of a bearing, pump or motor heading toward failure, long before it would trigger a hard alarm threshold.
- How many KPIs should a SCADA dashboard show?
- Dashboards work best when the number of KPIs shown is deliberately kept small: a screen with twenty indicators is harder to act on than one with five well-chosen ones, so it is worth periodically reviewing which KPIs actually drive decisions.
- What is the most effective way to reduce false alarms?
- Set deadbands so alarms do not chatter around a threshold, add short time delays before activation to filter transient spikes, and periodically review alarm rationalization to remove or reprioritize alarms that never require action.